.avif)
Intelligent Bidding

Tristan Wilson
How to Stop Guessing on Margin
It's 4pm. Bid is due tomorrow at 10.
The estimator, VP, and chief estimator are in the conference room. Good job. Good location. Work they want.
"Costs are $7.4 million. What do we bid?"
"What would it take to win?"
"I think that bridge job last year we went 10% and got beat."
"Let's go 5%. That ought to do it."
They submit at $7.77 million. Everyone goes home feeling good.
10:01 AM, the next morning.
Second place came in at $9.2 million.
They won the job and left $1.5 million on the table. Their takeoff was solid. Their costs were right. They just guessed wrong on the margin.
They made a million-dollar decision based on a half-remembered bid from last year. And nobody in the room thought twice about it.
Photo Credit: Me
$6.7 Billion in Guesses
That $1.5 million isn't an outlier. It's a Tuesday.
We analyzed $63 billion in DOT bid-build unit price work won across 15 states over three years. The spread between each winner's bid and the second-place bidder — that's money that was won and didn't need to be left. Across the top 50 contractors in each state, that number totaled $6.7 billion.
The average contractor leaves 9% on the table. Best in class sits between 3 and 5%.
Here's what that means in real money. If you're a $75 million contractor leaving 9%, that's $6.75 million a year in margin you captured but didn't need to surrender. Drop to 5% and you just found $3 million. That's a new fleet of iron. That's four estimators and a new office. That's the difference between growing and standing still.
In a 3-5% net margin business, you're losing more in missed opportunity than you're making in profit. And the kicker is: the estimator did their job. The costs were right. It's the margin call — made by the VP or the owner in the bid review — that's broken.
Now here's what the naysayers will say: "You're always going to leave money. That's competitive bidding." They're right. You are. And sometimes there are outliers. But there's a canyon between 5% and 12%. The contractors pulling that average up to 9% aren't unlucky. They're uninformed.
The One Thing That Separates the Best
The contractors who consistently land between 3 and 5% aren't smarter. They don't have better estimators. They don't have a sixth sense for pricing.
They have a process. And the process is simple.
They review what they bid on similar work and how they actually did. They study what the market bears on similar work and who won it. They combine both with their current appetite for the job. Then they pick a number — not from a gut feeling, but from evidence.
And after the bid opens, they close the loop. Every bid tracked. Every result logged. Every lesson fed back into the next decision.
That's it. That's the whole edge.
But here's the thing about edges that come from learning: they compound. Every bid you track makes the next one sharper. A contractor who's been running this process for three years has data on hundreds of bids. Their competitor who's "been doing this for 30 years" has memories — which are unreliable, biased, and mostly wrong.
The longer you run the loop, the wider the gap gets. And the gap doesn't close because your competitor works harder. It only closes if they start running the same loop. Which means the contractors who start first build an advantage that widens with every bid cycle.
How to Actually Do It
Before I lay this out: everything that follows assumes you know your real costs. Not estimated. Actual. Cost is not margin. If you don't know your true costs, you're stacking guesses on top of guesses. Fix that first.
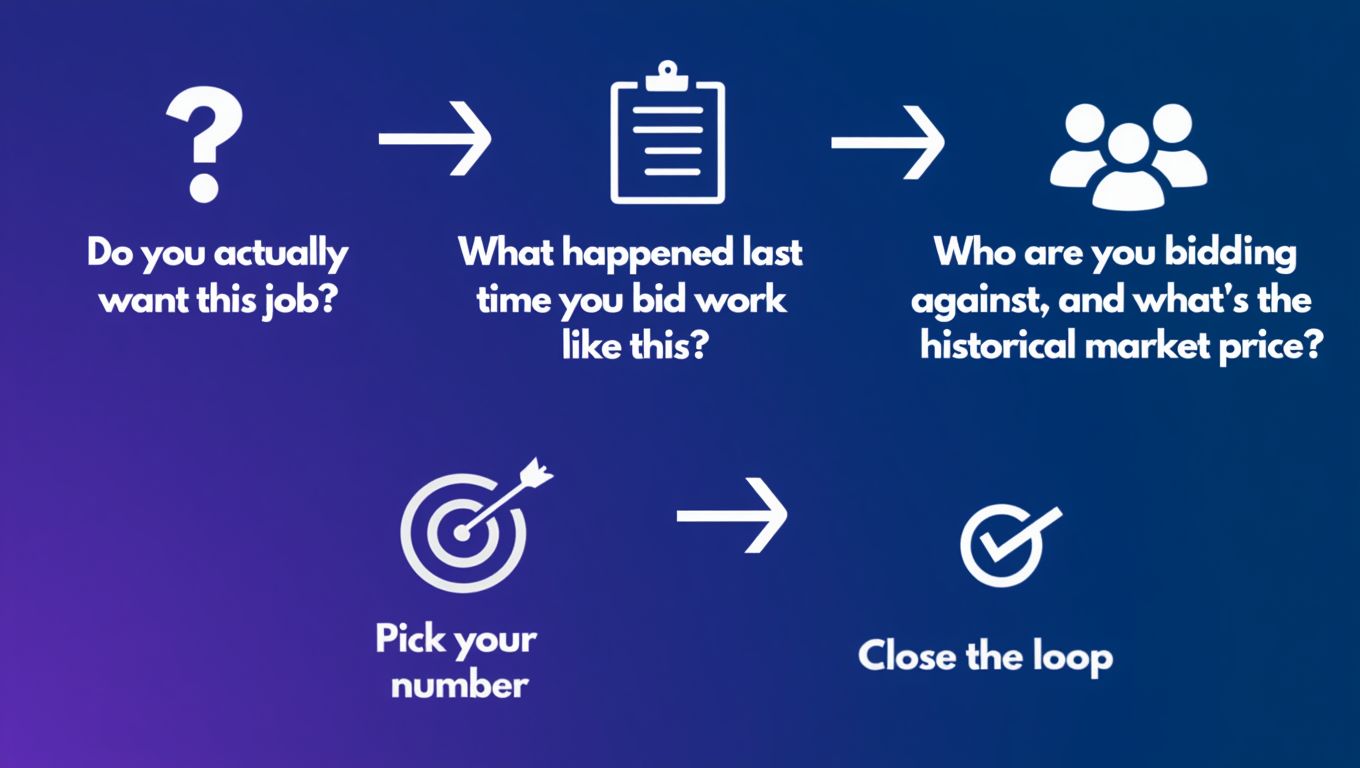
Do you actually want this job?
Before you price it, decide if you want it. What's the scope look like — any items that could blow up? Can you execute it well with the crews and equipment you have, or are you stretching? What's the owner like? If your last three jobs with this engineer were change order nightmares, that's not a risk factor on a spreadsheet — that's a reason to add margin or walk away. If the production rates suck and the market is good, factor that in here. Do you have advantages or disadvantages in takeoffs and pricing strategy? Quantity those. How does it fit your backlog? A contractor at 60% capacity prices differently than one at 95%.
What happened last time you bid work like this?
Pull your actual bid history on similar work. Same type, same size, same geography. Not what you think you bid. What you actually bid. Did you win? Lose? By how much? What margin did you target versus what you made? Are there job types where you're consistently too high? Too low? Winning work at margins thinner than they need to be?
This is where you see yourself clearly. Most contractors skip it because finding this information means digging through old folders, spreadsheets, and emails. By the time you find it, bid day is over.
Who are you bidding against, and what's the historical market price?
Who's likely to show up? What's their recent track record? Are they hungry or full? What are statewide and regional averages telling you about pricing on these items? Based on all of it — what's the probable winning range?
This is where bid tabs become useful. Not filed away in a drawer. Actually organized, searchable, and used to see patterns.
Pick your number.
Combine your history with the market data. Your capacity with your appetite. The competitive landscape with your operational strengths. Where in the probable winning range should you land?
The data doesn't replace your judgment. It informs it. You still make the call. But now you're making it with information instead of "I think it was that bridge job last year."
Close the loop.
After the bid opens: capture every bidder, every amount, every ranking. How close was your expected low bid to actual? How much did you leave on the table — or lose by? What would you do differently?
This is the step everyone skips because the next bid is already on the desk. It's also the step that makes every future decision sharper.
Intelligent Bidding
Why Most Contractors Don't Do This
Not because they're lazy. Because the manual version is impractical.
Reviewing similar bids requires finding them. That means digging through years of files in the window between "costs are done" and "bid is due." Organized market data requires bid tabs from the last two years, sorted by work type, searchable by geography and competitor. Nobody has that sitting in a folder ready to go.
The framework is simple. Five questions you could write on a napkin. Executing it with filing cabinets and spreadsheets under bid-day pressure? That's where it falls apart.
Humans can answer these questions. They just can't answer them fast enough, often enough, and consistently enough to build the compounding edge that separates 5% from 12%.
The Bottom Line
Every bid is a margin decision. Estimating is getting costs right. Bidding is getting price right. They're not the same thing. And right now, most pricing decisions are made by a brave and lonely VP in a conference room at 4pm the day before bid day, working off a feeling about a job he half-remembers from last year.
Your estimator spent 30 days getting the costs right. The margin call gets 5 minutes and a guess. That's where the $6.7 billion went.
Somewhere today, a VP is sitting in that room, looking at solid costs, and about to guess on the margin. He'll go home feeling worried about the number. Tomorrow at 10:01, he'll find out what that guess cost him.
It doesn't have to be you.
This analysis is based on $63 billion in DOT bid-build unit price work won across 15 states from 2023–2025. "Left on the table" is measured as the spread between the winning bid and the second-place bidder on multi-bidder lettings — representing margin opportunity missed by the winner.
For questions or to discuss how this applies to your operation, reach out to me.

.avif)


.svg)